Berlinfographicsby Berlin Experiences

1943–1946Berlin’s lost homes

Mitte lost more than half its homes to the war. Pankow lost fewer than one in ten

On 1 January 1943, before the start of the air war, Berlin had 1,562,641 usable homes. When the city counted again on 13 April 1946, it found 1,061,846 — almost a third gone. How many depended on where you lived: 53.8% in Mitte, 9.4% in Pankow.

Scroll through the twenty boroughs

The Reichstag, in the borough of Tiergarten, on 3 June 1945. Tiergarten lost 50.6% of its homes.Sgt Hewitt, No. 5 Army Film & Photographic Unit, 1945. Imperial War Museum BU 8573, via Wikimedia Commons. Public domain.

011 January 1943 – 13 April 1946

Between 1943 and 1946, half a million homes — 32.0% of the city’s — were gone

The statistics office of the Magistrat, Berlin’s city government, set two counts side by side: the usable homes on 1 January 1943, before the start of the air war, and those found by the housing count of 13 April 1946. The difference is 500,795 homes.

That is the city’s own figure for the “loss of dwellings through the war”. It counts homes — flats and dwellings — not houses.

Berlin’s usable homes · one square ≈ 5,000 homes

still usable, 13 Apr 1946: 1,061,846gone since 1 Jan 1943: 500,795
People with salvaged furniture and bundles in a street of damaged buildings.
Berliners bombed out of their homes after a British air raid, 1943. Original Bundesarchiv caption: “Ausgebombte nach britischen Luftangriff”.Bundesarchiv, Bild 146-1978-085-28 / Unknown / CC BY-SA 3.0 de

02Twenty boroughs, one map

The war did not fall evenly: three boroughs lost more than half their homes, four fewer than one in seven

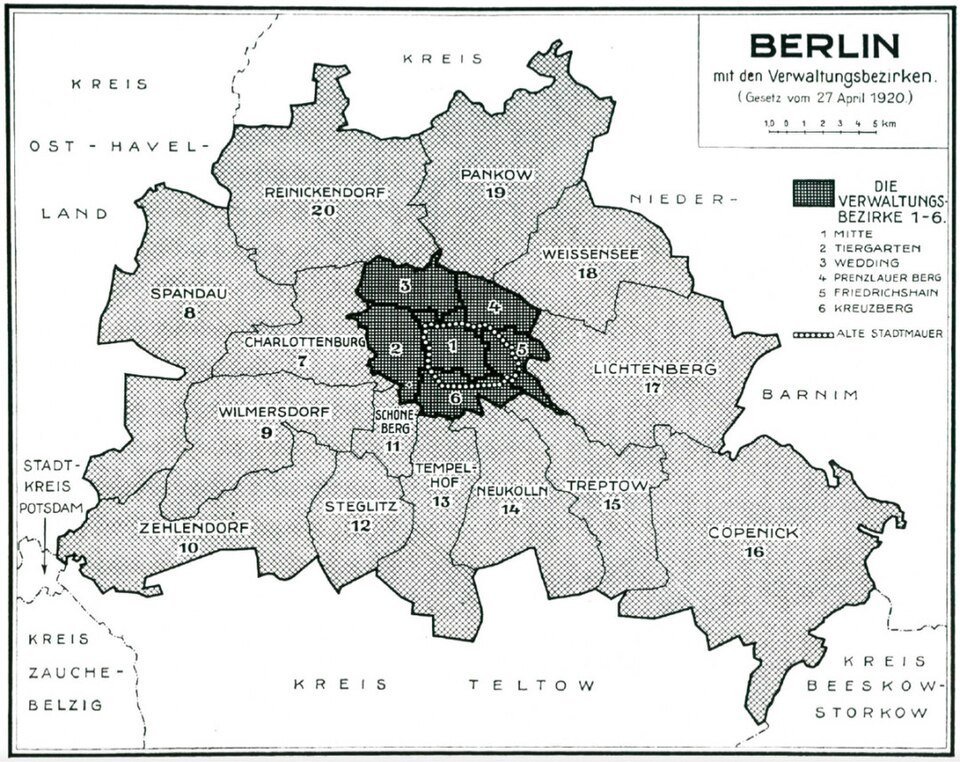
The count is broken down by the twenty boroughs Greater Berlin was divided into in 1920. They are the boroughs on Paul Wittig’s map, and the map that follows draws them on today’s ground.

A map of Berlin divided into twenty numbered districts; six small dark districts sit in the middle of a much larger pale area.
Berlin and its twenty boroughs under the law of 27 April 1920 — the same twenty the 1946 count used. Map by Paul Wittig, 1930.Paul Wittig, 1930. Wikimedia Commons. Public domain.
20boroughs of Greater Berlin, 1920
A map of Berlin’s twenty boroughs of 1946. As you read, each borough is shaded by the share of its usable homes lost between January 1943 and April 1946, then drawn as circles sized by the number of homes lost.
Outlines: today’s Ortsteile grouped into the 1946 boroughs — close, not exact. © OpenStreetMap contributors
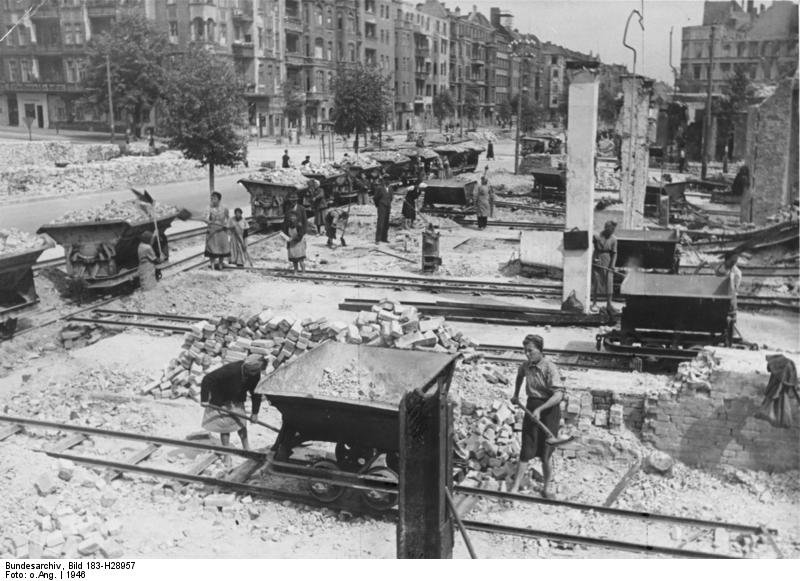
A wide street lined with ruined apartment blocks; small rail wagons loaded with rubble run along it.
Rubble clearance on Frankfurter Allee at Proskauer Straße, Friedrichshain, 1946, with tipper wagons on a field railway. The archive’s caption strip is part of the print. Bundesarchiv, Bild 183-H28957 / Unknown / CC BY-SA 3.0 de

1 January 1943

1,562,641 homes in twenty boroughs

Before the start of the air war, the statistics office counted 1,562,641 usable homes across Berlin. The biggest borough by homes was Friedrichshain, with 132,779.

Source: Berlin in Zahlen 1946/47, p. 185

13 April 1946

By April 1946, 32.0% were gone

The housing count found 1,061,846. Each borough is now shaded by the share of its homes that had disappeared from the count: the brighter, the greater the loss.

Source: Berlin in Zahlen 1946/47, p. 185

A vast ruined government building with empty window openings, seen across a rubble-strewn street.Mitte · 1945
A wide street lined with ruined apartment blocks; small rail wagons loaded with rubble run along it.Friedrichshain · 1946
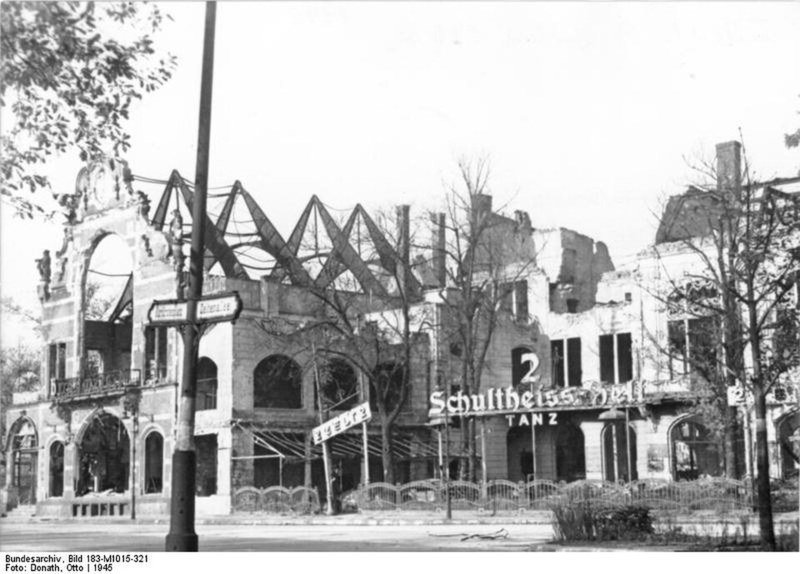
The shell of a large building among bare, shattered trees.Tiergarten · 1945
Mitte: Yevgeny Khaldei, 1945. Wikimedia Commons. Public domain. · Friedrichshain: Bundesarchiv, Bild 183-H28957 / Unknown / CC BY-SA 3.0 de · Tiergarten: Bundesarchiv, Bild 183-M1015-321 / Donath, Otto / CC-BY-SA 3.0
three boroughs

Mitte, Friedrichshain and Tiergarten: more than half gone

Mitte lost 53.8%: 96,430 homes became 44,550. Friedrichshain lost 50.8%: 132,779 homes became 65,334. Tiergarten lost 50.6%: 75,215 homes became 37,161. All three lie at the centre of the city.

Source: Berlin in Zahlen 1946/47, p. 185

A red-brick town hall with a tall tower above a busy street with cars and a yellow bus.Steglitz · 2009
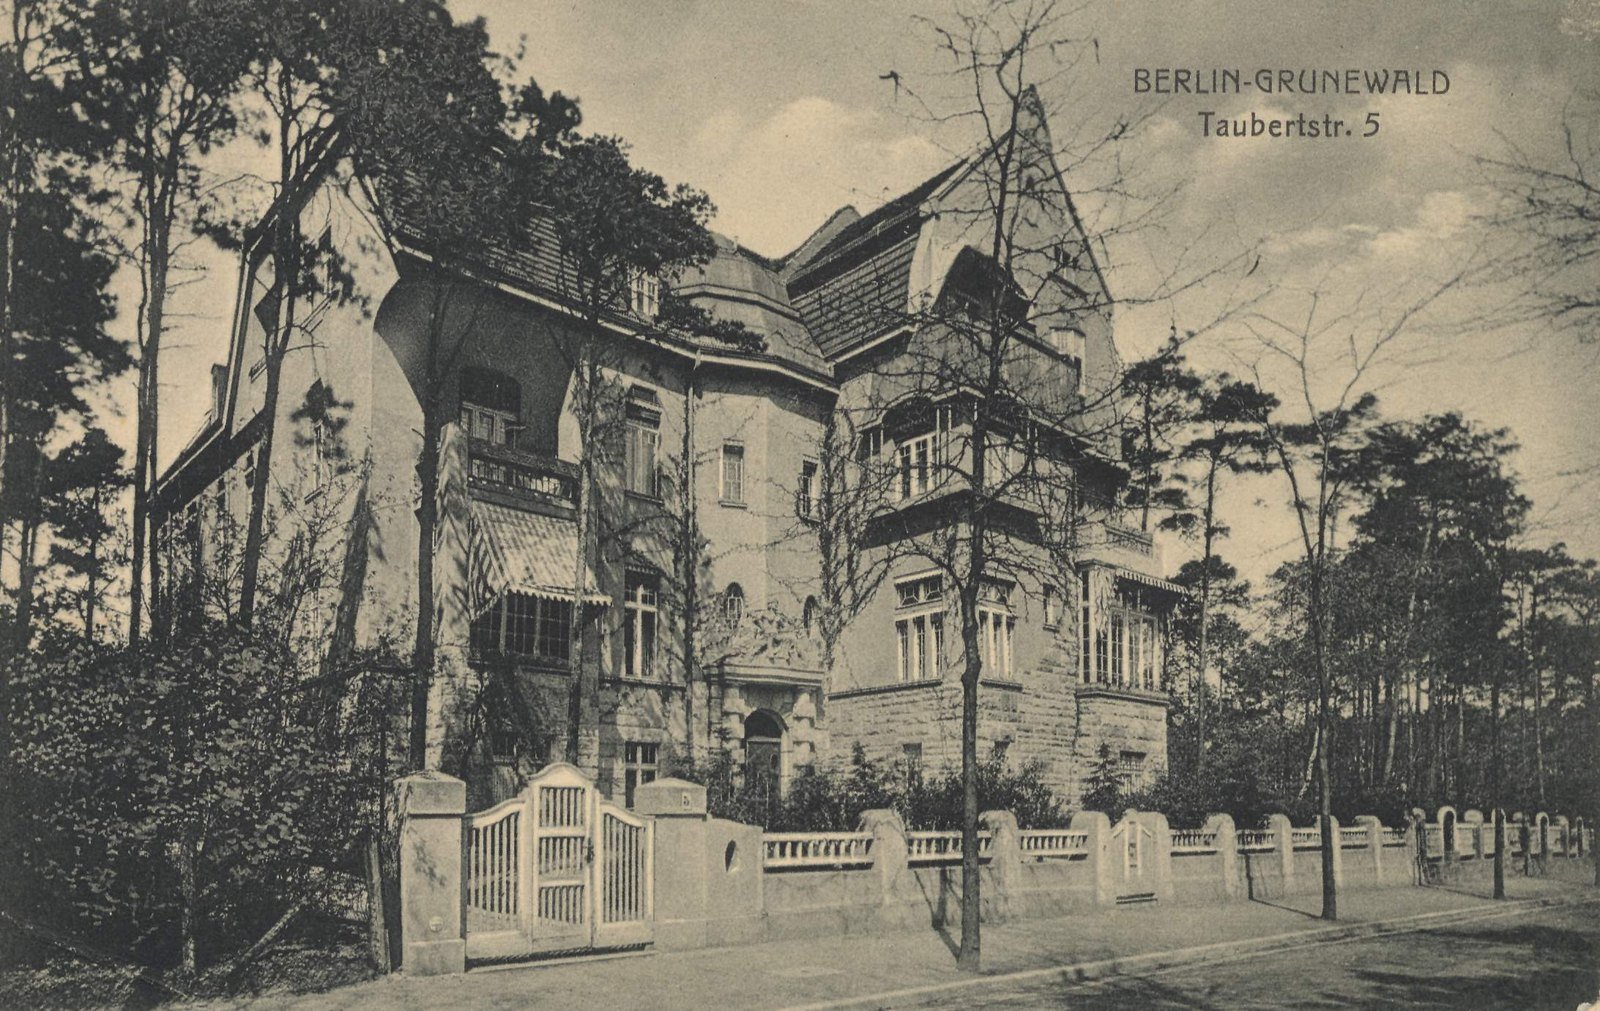
A sepia postcard of a large gabled villa behind a garden fence among pine trees.Wilmersdorf · c. 1900
Burnt-out tram cars in a street of damaged buildings, with a narrow path cleared through the rubble.Kreuzberg · 1945
Steglitz: Wampile, 2009. Wikimedia Commons. Public domain. · Wilmersdorf: Voremberg, Berlin, 1900. Wikimedia Commons. Public domain. · Kreuzberg: Bundesarchiv, Bild 183-J31328 / (Otto) Hofmann / CC BY-SA 3.0 de
The south-west

Steglitz and Wilmersdorf lost a larger share than Kreuzberg

Steglitz lost 44.8% and Wilmersdorf 44.2% — more than Kreuzberg’s 41.7%. Distance from the centre was no guarantee.

Source: Berlin in Zahlen 1946/47, p. 185

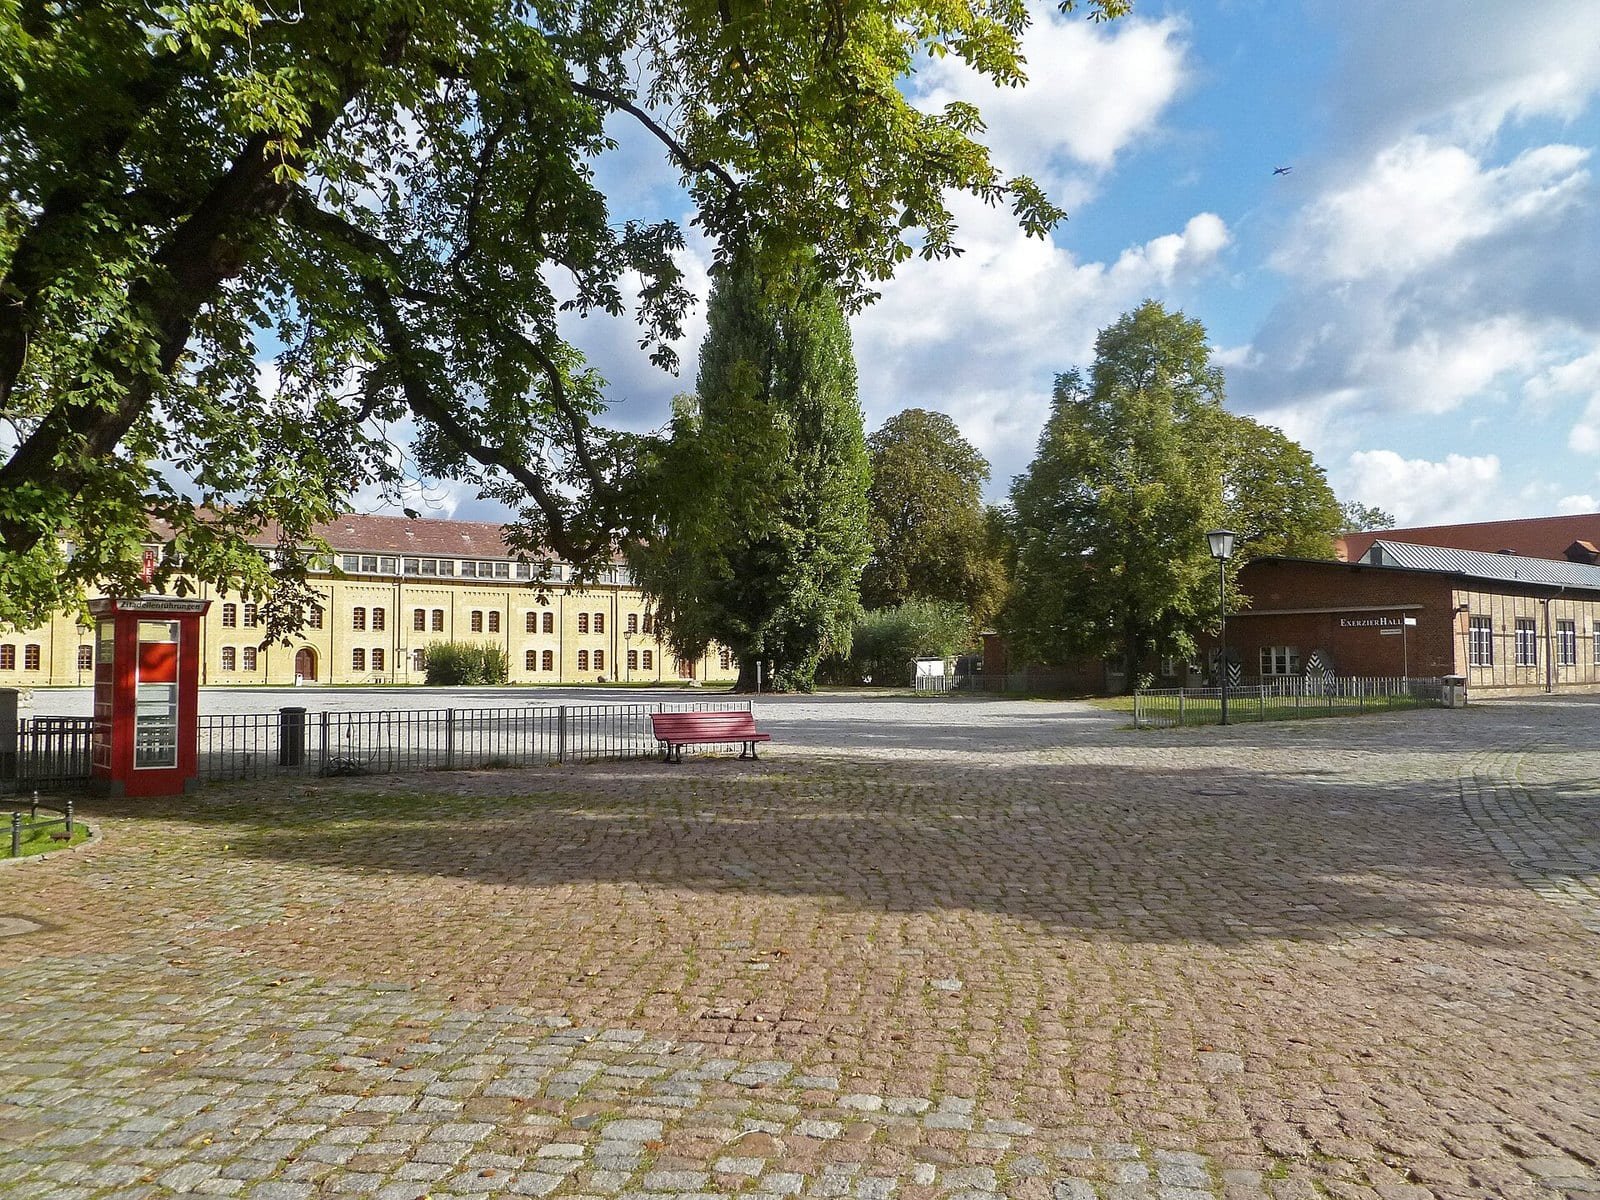
A cobbled square inside a fortress, with long low buildings and trees behind.Spandau · 2011
Tall white apartment blocks seen through birch trees across a park.Reinickendorf · 2012
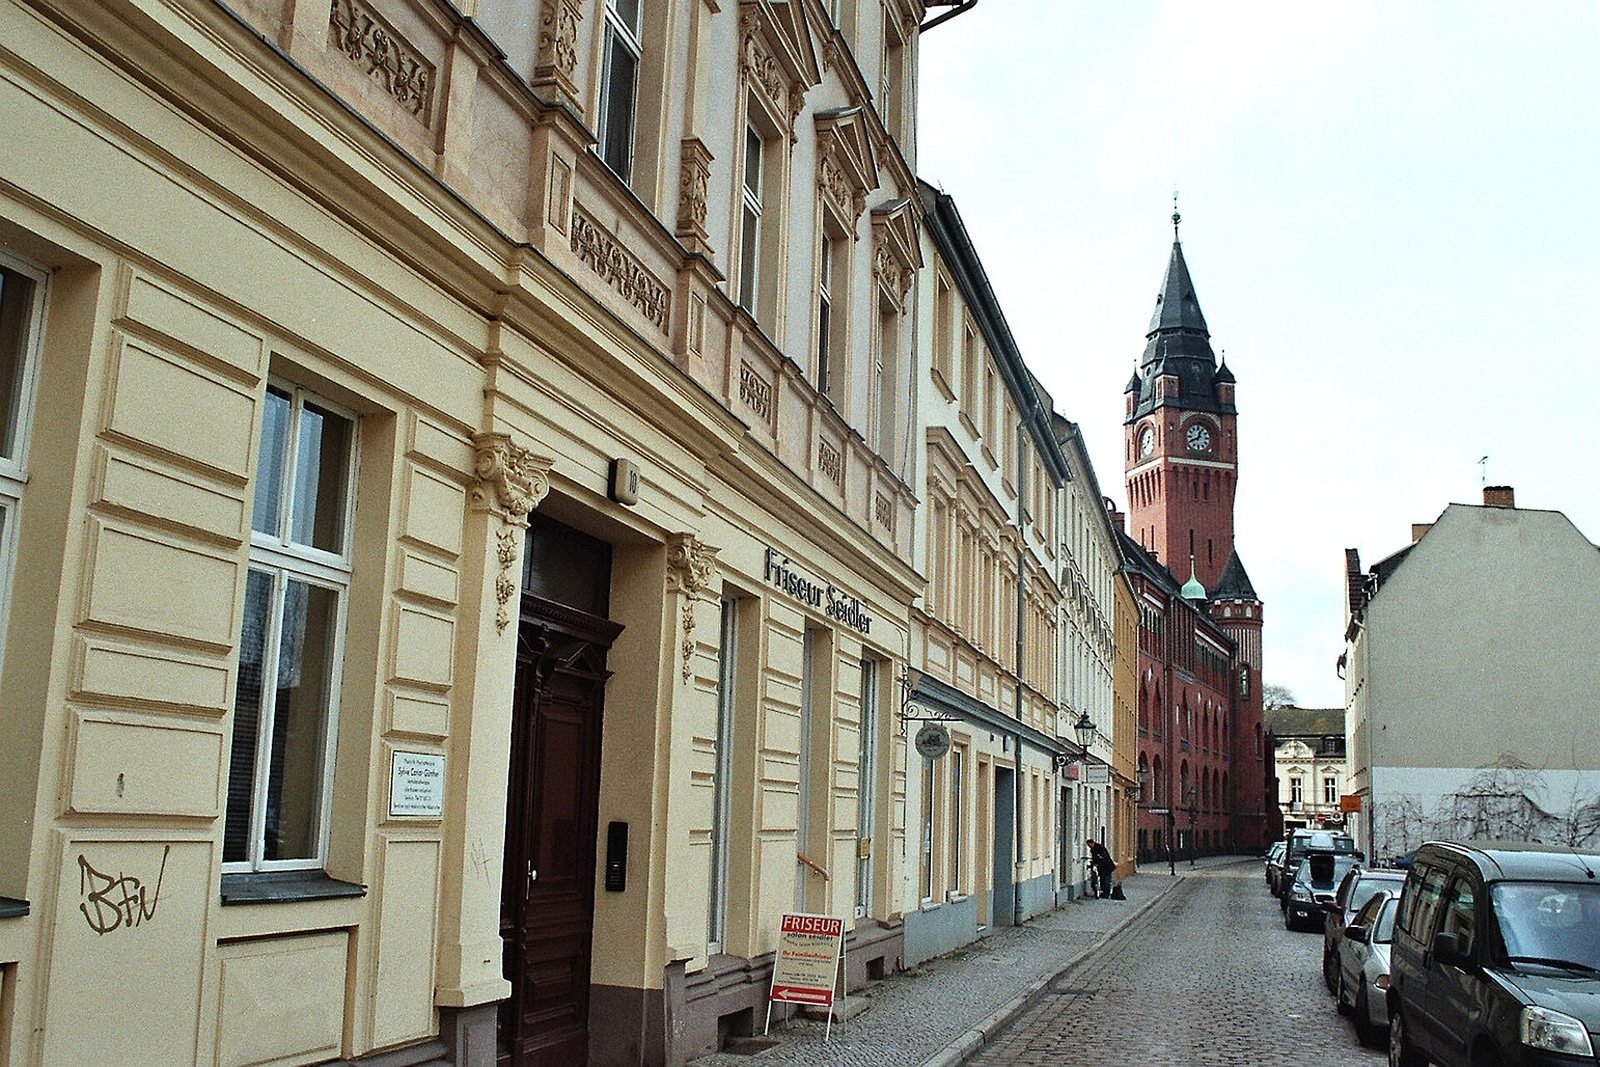
A narrow street of old town houses leading to a red-brick town hall tower.Köpenick · 2006
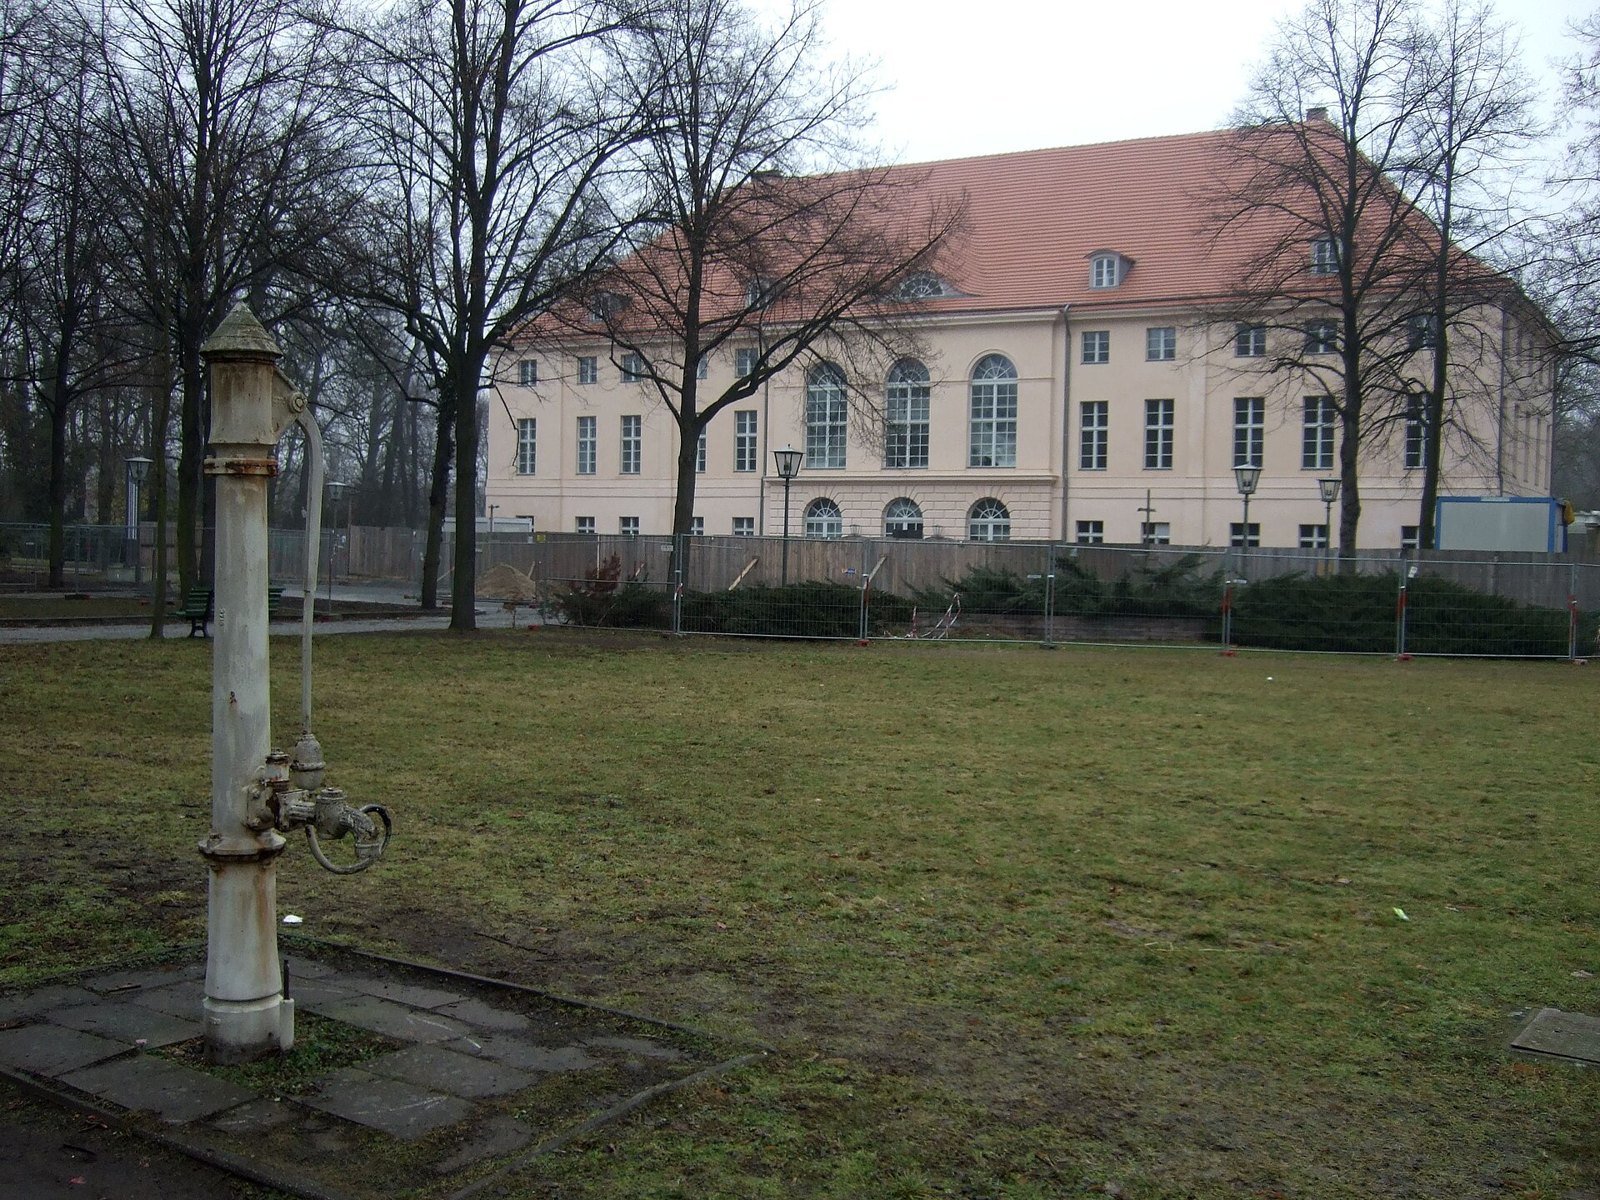
A pale two-storey palace with a red roof behind bare trees and a lawn with an old water pump.Pankow · 2009
Spandau: JoJan, 2011. Wikimedia Commons. CC BY 3.0. · Reinickendorf: Jörg Blobelt, 2012. Wikimedia Commons. CC BY-SA 4.0. · Köpenick: Dguendel, 2006. Wikimedia Commons. CC BY 4.0. · Pankow: Sebastian Wallroth, 2009. Wikimedia Commons. Public domain.
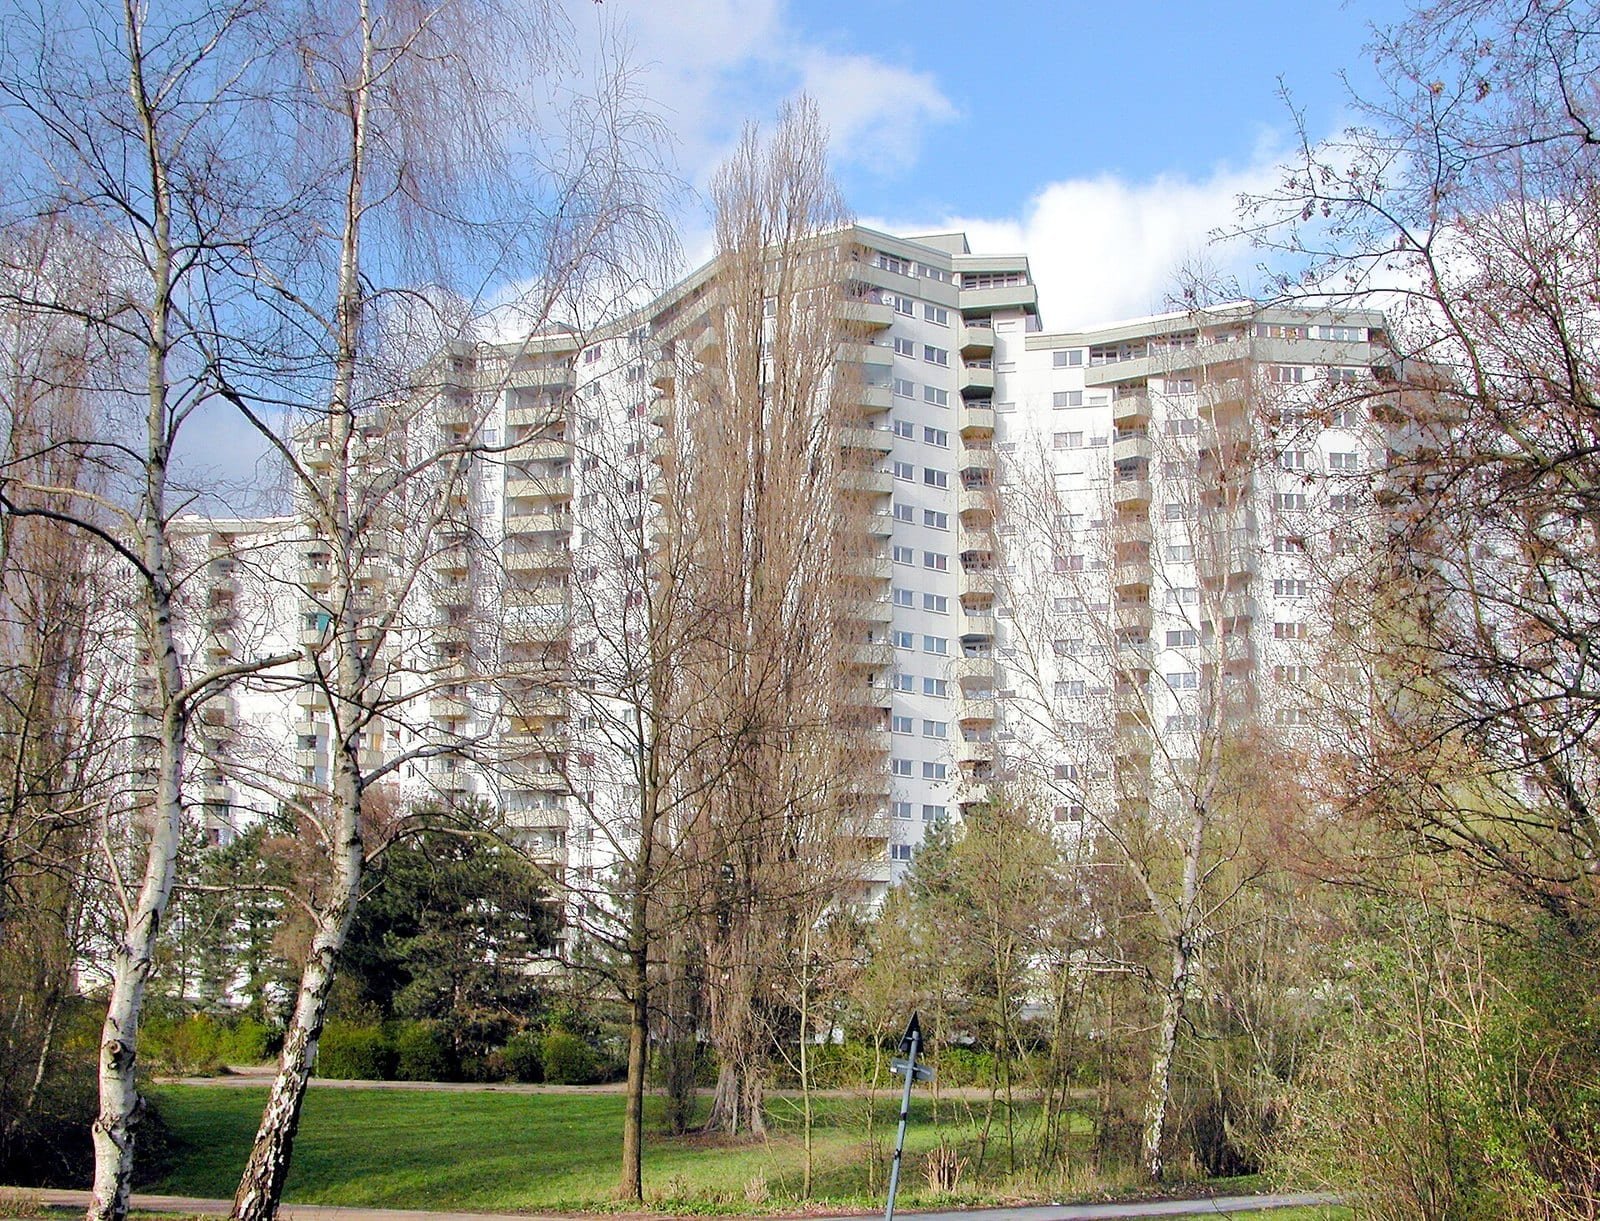
The edge of the city

Four boroughs lost fewer than one home in seven

Spandau 13.9%, Reinickendorf 11.0%, Köpenick 10.7%, Pankow 9.4%. Pankow kept 90.6% of its homes — 48,508 of 53,520.

Source: Berlin in Zahlen 1946/47, p. 185

A wide street lined with ruined apartment blocks; small rail wagons loaded with rubble run along it.
Rubble clearance on Frankfurter Allee at Proskauer Straße, Friedrichshain, 1946, with tipper wagons on a field railway. The archive’s caption strip is part of the print. Bundesarchiv, Bild 183-H28957 / Unknown / CC BY-SA 3.0 de

In numbers of homes

Friedrichshain lost the most homes: 67,445

Counted in homes rather than shares, the circles show where the loss was largest. Friedrichshain lost 67,445 — more than Pankow had in 1943 (53,520).

Source: Berlin in Zahlen 1946/47, p. 185

All Berlin

500,795 homes gone

Across the city, 500,795 homes left the count — 32.0%. Eight of the twenty boroughs lost a larger share than the city as a whole.

Source: Berlin in Zahlen 1946/47, p. 185

Outlines: today’s Ortsteile grouped into the 1946 boroughs — close, not exact. © OpenStreetMap contributors

03The ledger

Each bar is one borough’s homes of 1943. The yellow part had gone from the count by 13 April 1946; the blue part was still usable. The dashed line is the city as a whole, 32.0%.

Share of usable homes lost, 1 Jan 1943 – 13 Apr 1946

loststill usableAll Berlin

Of every ten homes

04Borough by borough

The ruins in these photographs stand in the boroughs that lost the most

Pictures from the boroughs that lost most, each tagged with its borough’s loss from the 13 April 1946 count. Most were taken in 1945, after the air raids and the battle; the Schöneberg picture dates from the summer of 1944.

Mitte −53.8%

A vast ruined government building with empty window openings, seen across a rubble-strewn street.
The government quarter on Wilhelmstraße, Mitte, June 1945, photographed by Yevgeny Khaldei.Yevgeny Khaldei, 1945. Wikimedia Commons. Public domain.
Tiergarten −50.6%

The shell of a large building among bare, shattered trees.
The destroyed restaurants “In den Zelten” in the Tiergarten, 1945. Original Bundesarchiv caption.Bundesarchiv, Bild 183-M1015-321 / Donath, Otto / CC-BY-SA 3.0

Kreuzberg −41.7%

Burnt-out tram cars in a street of damaged buildings, with a narrow path cleared through the rubble.
Wrecked trams in Oranienstraße, Kreuzberg, after the air raid of 3 February 1945; a path has been cleared beside them. Original Bundesarchiv caption.Bundesarchiv, Bild 183-J31328 / (Otto) Hofmann / CC BY-SA 3.0 de

Charlottenburg −38.8%

The broken spire of a large church above ruined surroundings.
The war-damaged Kaiser-Wilhelm-Gedächtniskirche, Charlottenburg, 7 July 1945.Hewitt C H (Sergeant), No 5 Army Film Photographic Unit, 1945. Wikimedia Commons. Public domain.
Schöneberg −35.7%

A buckled railway viaduct propped up on stacks of timber beams above a street.
The elevated railway viaduct on Bülowstraße, Schöneberg, after an air mine on 19 July 1944, propped up with stacked timber. Original Bundesarchiv caption.Bundesarchiv, Bild 183-J30192 / Unknown / CC BY-SA 3.0 de

Mitte −53.8%

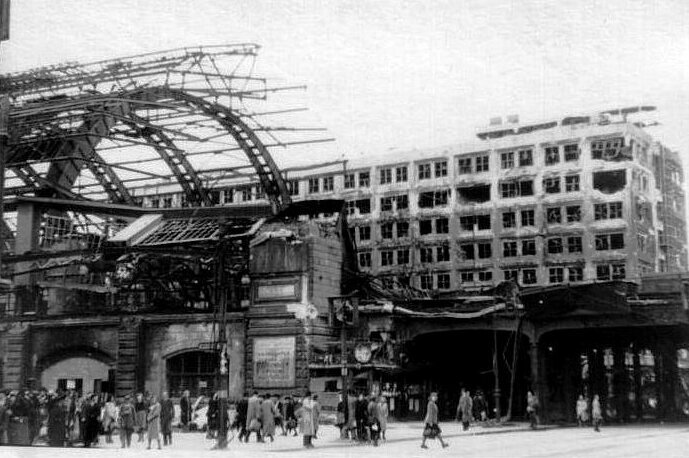
The iron and glass roof of a railway hall, its glazing blown out, over a wrecked platform.
The damaged hall of Alexanderplatz station, Mitte, 1945. Original Bundesarchiv caption.Bundesarchiv, Bild 204-022 / Gorovits, Henryk / CC BY-SA 3.0 de

Friedrichshain −50.8%

A wide street lined with ruined apartment blocks; small rail wagons loaded with rubble run along it.
Rubble clearance on Frankfurter Allee at Proskauer Straße, Friedrichshain, 1946, with tipper wagons on a field railway. The archive’s caption strip is part of the print.Bundesarchiv, Bild 183-H28957 / Unknown / CC BY-SA 3.0 de

05The count of 13 April 1946

“Lost” means gone from the count: destroyed, uninhabitable — or taken by the occupiers

The housing count recorded only dwellings with at least one usable room. Its own rule, printed with the tables:

Not counted: dwellings wholly destroyed, wholly uninhabitable, or requisitioned by the occupying powers.Berlin in Zahlen 1946/47, p. 173

So the loss in each borough includes homes requisitioned by the Allies as well as homes destroyed by bombs and shells. The yearbook gives no split between the two.

It also counted about 42,000 homes in huts, garden-colony sheds and emergency shelters — so the fall in permanent homes was somewhat larger than the net figures here.

Berlin · 1943 / 1946

The war took almost a third of Berlin’s homes. Where you lived decided the odds: more than one in two in Mitte, fewer than one in ten in Pankow.

Press & citation

Use this Berlinfographic

Free to publish under CC BY 4.0 — in print, online, on Wikipedia and in teaching, commercially or not — with credit to Berlinfographics and a link to this page.

Berlin’s lost homes, borough by borough, 1943–1946: ready-to-use landscape image

Ready-to-use image

The infographic as one image: headline, key figures, chart, sources and credit, 2,400 × 1,350 px PNG. Please use it unedited.

Download landscape (PNG)
Berlin’s lost homes, borough by borough, 1943–1946: square version

Square format

A 1:1 version for social media and narrow columns, 1,800 × 1,800 px.

Download square (PNG)
Berlin’s lost homes, borough by borough, 1943–1946: portrait version

Portrait 4:5

For Instagram and LinkedIn feeds, 1,620 × 2,025 px.

Download portrait (PNG)

Credit line

Berlinfographics (berlinfographics.com), CC BY 4.0

Citation

Berlinfographics (2026). “Berlin’s lost homes, borough by borough, 1943–1946”. Berlin Experiences. https://berlinfographics.com/district-destruction/

Wikipedia

{{cite web |title=Berlin’s lost homes, borough by borough, 1943–1946 |url=https://berlinfographics.com/district-destruction/ |website=Berlinfographics |publisher=Berlin Experiences |date=2026-11-05 |access-date=2026-11-05}}